
Contribution, credit and incrementality are different questions.
Why three useful measurement views should not collapse into a single performance number.
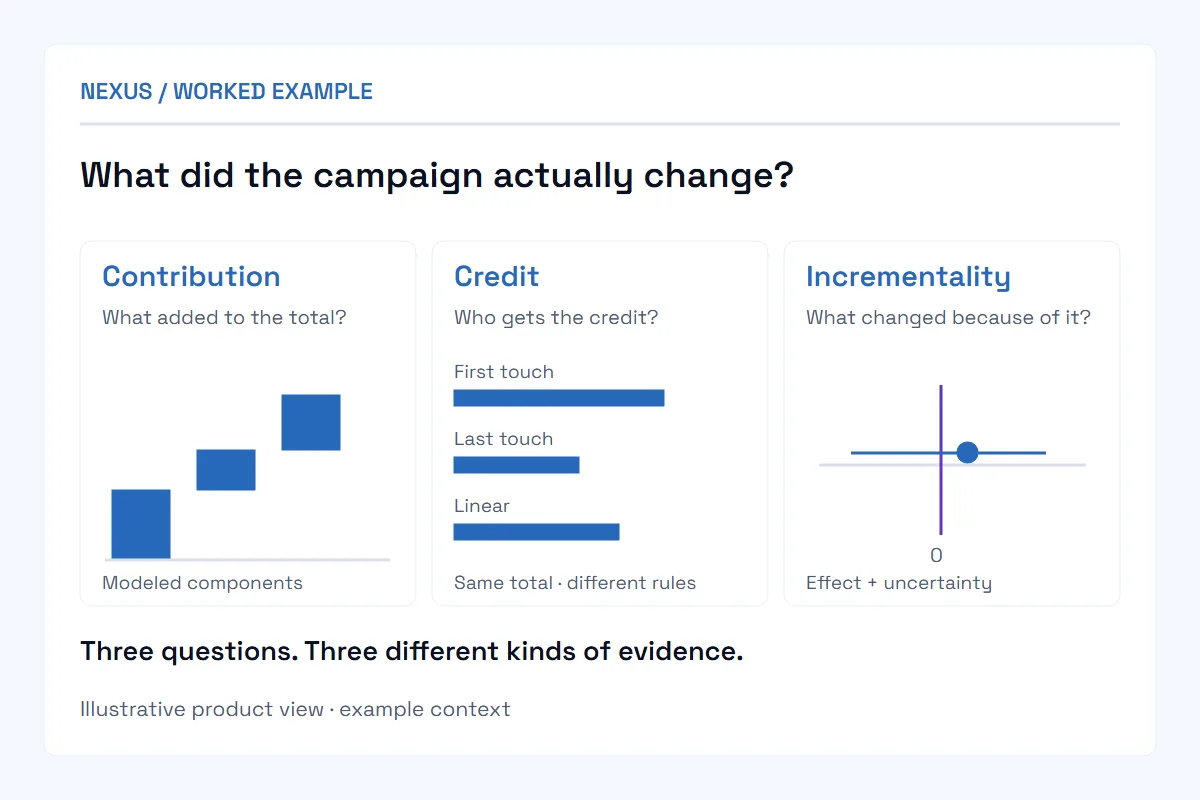
Marketing mix modeling, attribution and experiments answer three different questions: what contributed over time, how observed credit is allocated, and what happened because of an intervention. Use them together, but keep their units, windows and assumptions separate.
Key takeaways
- Name the quantity before reading the chart: contribution, credit or incremental effect.
- Marketing mix modeling estimates aggregate contribution over time and depends on its modeling assumptions.
- Attribution redistributes credit across observed touchpoints; changing the rule does not change the conversions.
- Incrementality needs a credible comparison, and a small experiment can be inconclusive.
Name the quantity before the chart
A channel can receive attribution credit without that credit being a direct estimate of incremental effect. A modeled contribution can be useful while depending on assumptions that need scrutiny. Start by writing the business question in ordinary language: what happened, how should observed credit be allocated, or what would have happened without the intervention? The chart is only useful once its quantity is clear.
Contribution over time
Marketing mix modeling examines aggregate outcomes alongside media and other explanatory inputs. Google’s Meridian documentation describes contribution, response curves and budget scenarios as related outputs, with controls, lagged effects and saturation within its modeling workflow. That is a modeling process, not a justification for drawing a smooth curve over any available sales series.
The worked example on this site uses constructed monthly components so you can inspect how the totals work. It is not a fitted Meridian model or any other production MMM.
Reference: Google Meridian: introduction ↗
Credit across an observed journey
Attribution assigns credit across touchpoints. To expose that distinction, our worked example redistributes the same 100 conversions under three simple teaching rules. First touch assigns 55 to social, 30 to search and 15 to retail. Last touch assigns 15, 60 and 25. Linear assigns 35, 40 and 25. Every column still totals 100.
The comparison shows the consequence of a rule; it does not demonstrate that changing spend would create another conversion. These teaching rules are not a list of currently supported Google Analytics models.
A comparison with uncertainty
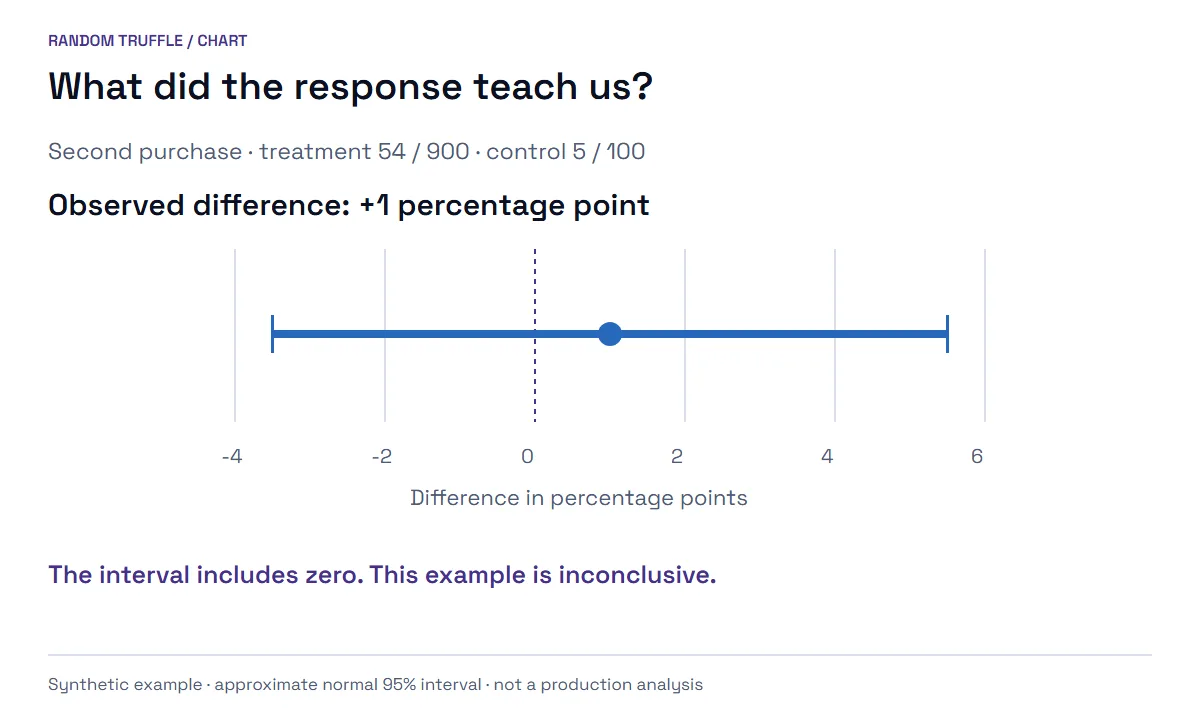
Our worked experiment records 54 second purchases among 900 treatment participants and 5 among 100 control participants. The rates are 6% and 5%, an observed difference of one percentage point. The approximate normal 95% interval spans roughly −3.5 to +5.5 points. It includes zero.
The useful conclusion is that this small example is inconclusive—not that the campaign delivered a proven lift. A production analysis would need an appropriate design, diagnostics and statistical treatment.
Use the views together without mixing their meanings
A planning conversation can use attribution to inspect observable journeys, a validated MMM to investigate aggregate response and an experiment to examine a specific intervention. Preserve the different units, windows and assumptions when connecting them. Do not silently substitute a platform conversion total for a business outcome or a modeled number for experimental evidence.
What the agent should carry forward
The handoff should contain the question, source definitions, method, uncertainty and proposed decision. It should also name the evidence that would justify revisiting the decision. A clearer next question is often more useful than a more confident summary.
Common questions
Is attribution the same as incrementality?
No. Attribution allocates credit for observed conversions among touchpoints. Incrementality asks what would have happened without the campaign, which requires a comparison such as a randomized holdout.
What does marketing mix modeling measure?
It examines aggregate outcomes over time alongside media and other explanatory inputs to estimate each factor’s contribution, using controls, lagged effects and saturation.
Can an experiment be inconclusive?
Yes. In the worked example, 6% of the treatment group and 5% of the control group made a second purchase, but the approximate 95% interval of −3.5 to +5.5 points includes zero, so it does not establish a lift.
Make the question concrete.
Inspect the worked example and its assumptions in the agent conversation.
Open the Nexus conversation →Further reading
Primary documentation consulted for this note.
Keep exploring.
 Measurement / 5 MIN READ
What would have happened without the campaign?
Define a credible comparison, inspect uncertainty and distinguish incremental effect from attribution credit.
Read the field note → Audience intelligence / 4 MIN READ
An audience is a hypothesis, not a label.
A practical way to connect behavior, context and the next question—without pretending a segment explains a person.
Read the field note →